Showing posts with label Bayesian Methods. Show all posts

Tuesday, September 23, 2008

Group-level variances and correlations

This is just a sum-up of what we should do when we try to estimate the group-level variances and correlations but the software failed to do so. As a R and lmer() user, I found this happens often.

If this is the case, there are three potential problems:

(1) sd is 0
(2) some correlations are -1 or 1
(3) covariance matrix is singular

If the problem is of (1), then we might as well forget about the group level.

If the probem is of (2) and (3), we can rescale the X's so that the correlation between intercepts and slopes will be altered. For instance,

y = a + bx --> y = a + bz where z = x - x.bar

Nonetheless, in the end day, as Andy suggests, we should stick priors to estimating group-level variances and correlations. This ensures computational stability.

Saturday, September 22, 2007

Auto OpenBUGS fitting and checking for convergence

Fitting a BUGS model can be frustrating. Sometimes it takes thousands of iterations to get a model converged. Reparametrize your parameters can speed up the converging. Professor Andrew Gelman has a paper talking about this issue.

I am lucky enough to have both training on fitting BUGS models using R2WinBUGS and WinBUGS/OpenBUGS. I like to use R2WinBUGS when the model is easy to converge. I have the summary statistics and convergency statistics ready to use when using R2WinBUGS.

However, if the model converges slowly (and you don't want to do the reparametrization), R2WinBUGS is not a good choice. Because R2WinBUGS does not save the last state of the MCMC chains. The last.values slot saves the last values of the saved parameters. The parameter-to-save is not necessarily the parameters that needs initial values for priors. So this mean when you figure out the model does not covergerged, you might have to re-run the MCMC chains from the low density area again based on the newly genereated priors. On the other hands, you can always stop and check and start again when you fit BUGS models using WinBUGS/OpenBUGS. But the checking procedure is time-consuming.

One alternative is to fit BUGS models using BRugs. BRugs is an R package that links to OpenBUGS. BRugs can save the last state of the parameters that needs priors. After you fit a
OpenBUGS model, just type:

modelSaveState("*")

You will have inital values saved as the txt files in your working directory. The other nice feature of BRugs is that if you find the model does not converged, you just type:

modelUpdate(numUpdates=1000)

You can restart the BUGS model from the last state and update for another 1000 iterations.

But...But...But...You still need to save the coda files:

samplesCoda("*")

Read in the code files. The file name has to be save as "CODAchain1.txt" and "CODAindex.txt".

output <- read.openbugs(stem=working.directory)

And do the convergence check.

gelman.diag(output)
geweke.diag(output)

This is annoying and time-consuming. So I wrote a function that fits BUGS models using BRugs and checks the converegence. If the model does not converged, it will update another 1000 (default) iterations. The loop of fitting and updating will stop only when either the model is converged or n.sims: (how many updating) is reached. The function uses codes from openbugs() in R2WinBUGS and modelUpdate() in BRugs. I uses Gelman and Rubin convergence statistics: Rhat to decide whether the model is converged or not.

The function is here.

Last words: If the model converges slowly, you might want to think about doing reparametrization first!!

Saturday, August 18, 2007

A Tricky Math Question

Q. A host wants you to pick which of the 3 doors has a gift behind it. And only one door has the gift. You got to pick one door first. He will show you one of the remaining that has no gift behind it. Is it a smart move to switch your pick after the host shows you one of the no-gift door?

My first thought is the probability that the gift is behind my pick or the other door is equal. So it does not matter if I switch or not. But I was wrong. Here is the solution:

Let A be the event that the door you picked has a gift behind it; B be the event that the opened door has no gift behind it. So what we are interested in is the probability of A given on B, p(A|B).

According to the Bayes' Law:

p(A|B)=\frac{p(A)p(B|A)}{p(B)}

We know that P(A)=1/3, p(B|A)=1. p(B) is also 1 because the host will make sure the door he opens has no gift behind it. So the answer of p(A|B)=1/3.

An easier way to think about the question is to list out all the situations. Suppose you pick door 1:

Scenario I: 1 has the gift and 2 and 3 have no gift. So don't switch.
Scenario II: 1 has no gift, 2 has the gift, 3 was open. So switch.
Scenario III: 1 has no gift, 3 has the gift, 2 was open. So switch.


It is clear that by switching the door, you only have 1/3 chance not to get the gift. So switching is a smart move if the host reveals one of the remaining doors that has no gift.

p.s Thanks for Charlie who entertained me with this question and provided the solution.

Friday, April 27, 2007

My love affair with BART

Professor Jennifer Hill gave a vivid talk at NYU today discounting the matching methods. In the middle of the talk, I was wondering that maybe it is Professor Donald Rubin's great tutorship that his students, Professor Andrew Gelman & Professor Jennifer Hill, whom I am lucky to work with, are both great presenters.

I am on Jennifer's side that I have switched my support from matching methods to BART (Bayesian Additive Regression Tree) an year ago.

BART 1.0-0
I might be the first student around Columbia University who uses BART. I recall that the first time Jennifer introduced BART in the Quantitative Research Seminar at Columbia, I was so excited to know there was an alternative exists. I was so frustrated by how different matching methods could possibly yield different estimates. So after Jennifer's talk, I tried BART right away. I was disappointed with BARTbecause it failed on a n=40 fake data, which the true treatment effect is 4. BART gave me the treatment effect of 1.8. I did not know what's going on and I did not know if I should ask Jennifer. She was always cool, sitting in Andy's multilevel modeling class. I did not know she was such a great tutor like Andy.

BART 2.0-0
Jeronimo Cortina is a great friend of mine. He just got his Ph.D at Columbia this April. A year ago, he told me he was working with Jennifer. So I asked him if he knew what's going on with BART. He did not know and he was not a fan of BART then. But he was upset with matching methods too. I told him he should try BART and I shared with him how to use BART. I was actually hoping that he could use BART in this work. This way, I could know the feedback of the real applied case of BART.

I was actually disappointed to know that Andy's suggestion for using BART is to use it as a robust check. But anyway, I had a chance to talk to Jeninfer through Jeronimo. I knew then that BART 1.0-0 was buggy when n<200.>

Becoming a fan of BART
Now I had a BART friend-Jeronimo and a BART instructor-Jennifer. So I began to use BART in my work. Whenever I had a new idea of making BART graphs, I share it with Jeronimo. Whenever I had a question about BART I ask Jennifer. I was so excited when I finished a work of a trichotomous treatments analysis using BART. This can be a bit challenging using matching methods because it involves using multinomial logit model to get propensity scores.

Does BART have its future?
During today's talk, someone asked Jennifer a very tricky question. The question I also had in my mind for a long time. He asked that if she is the journal reviewer of a causal inference paper using BART, how she is going to judge if the guy is doing the right thing.

Andy was skeptical about BART because he does not like the black-box-like procedure of BART. We learned that BART does outperform other methods. But there is no way now to know what's really going on inside. What variables are used? What are the interaction? I am worried about the future of BART if we can not show reader these stuffs. It might need times for BART to build up its fame that everyone is convinced the superiority of BART and takes the result of BART for granted.

Jennifer complains about how economic journal reviewers always give her hard time when she uses matching method in her paper (They don't trust the claim of the ignorability using matching). Those reviewers might have the same feeling over BART. Although I am a fan of BART, I am worried about the future of BART. In the meantime, maybe I will only use BART as a robust check to other methods.

Friday, April 20, 2007

MPSA in Chicago 2007

This year, I presented a paper in 65th MPSA conference. The title of the paper is "Who Receives Aid and Why?" I got many constructive comments about how to make my story more telling, how to improve my data analysis, and the problem of existing aid data (no data for Soviet and China aid). I was mostly stunned by the comment, saying that I should justify myself in the paper why I choose to use fancy multilevel modeling technique over simple alternatives.

In fact, I have a whole page in the paper, arguing why (Bayesian) multilevel modeling (BML) is better than other alternatives (OLS with PCSE's, FE, RE, etc). The paper by Shor et al (2007) in Political Analysis has shown the superiority of BML with the Monte Carlo experiments.

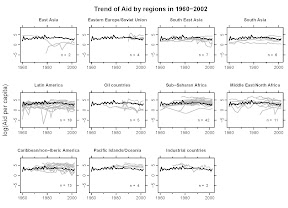
Besides theoretically arguments, I have a Figure (see below) where I plot aid trends by regions across countries from 1960--2002. The light lines indicate individual country aid trend and the dark lines represent the world average aid trend. The plot clearly shows that there are variation across regions, between countries and by years. So in the paper, I propose to use BML to model the aid allocation.


Today, I asked Andy's about his views on this issue. I got most out of his answers was his first quick and simple response: ``OLS is a special case of multilevel modeling where the group level variation is zero." For me, this is a straight forward way of looking at the issue of why BML not OLS. ``Multilevel modeling is an easier thing to do!" Although I don't know if others would believe this, but it is the case when you think about doing all kind of data transformations, creating dummies to correct the potential problem in the Time-Series Cross-sectional data.

Assuming my discussant read my paper carefully, she must have got the idea of why I used BML from the discussion in the page and the figure. So I am thinking maybe what she wanted was a hard evidence, showing that the BML's result is better. And this is in fact very common, at least for paper published in polisci journal, that authors always have a base model (OLS) in a table where all other advanced model are presented on the right of the OLS one.

I guess what I tries to convey in this entry is: if you believe your model is better (or correct), why bother going back to a simple model? Even if the results may be similar, we still get something out of the advanced modeling as we're definitely taking care of more aspects of the data. Maybe the norm of the discipline made us to do all this redundant procedure. But advanced modeling certainly does not necessarily mean more difficult to do.

Friday, February 02, 2007

The Power of the Bayesian Method: when n < k is not a problem

I have documented here about how priors in the Bayesian methods are used as new data (data augmentation). This is very useful when you have a model that has negative degree of freedom. Normally, we say this model cannot be identified as number of observation n is smaller than number of estimated parameters k. Traditionally, we have to accept that this problem is unsolvable. But with the aid of priors, we can actually increase k number of observations. So now the degree of freedom becomes n+k-k > k. The model is identifiable. I have mentioned about bayesglm here which is exactly developed for this problem. bayesglm is now in R package: arm.

When is it a problem? Normally, when we are dealing with a fixed-effect model, this would be a potential problem. Traditionally, dealing with the fixed effect model, we add dummies into the model. If we have small n, but many individual units a (e.g., countries), we will encounter the problem that n-(k+a) <>. If we have priors for (k+a) parameters, we can identify the model as n + (k+a) - (k+a) > 0.

Monday, September 25, 2006

Bayesian GLM

I recently work with Professor Andrew Gelman, Aleks Jakulin and Maria Grazia Pittau on a paper -- a default prior distribution for logistic and other regression models. The R function for the model is bayesglm.R.

Basically, the idea is: when we try to fit a logistic model, if we happen to have a perfect predictor, the model will fail to converge. Our function is to fit this model by setting default prior distribution on coefficients. Below is the abstract of the paper.

We propose a new prior distribution for classical (non-hierarchical) logistic regression models, constructed by first scaling all nonbinary variables to have mean 0 and standard deviation 0.5, and then placing independent Student-t prior distributions on the coefficients. As a default choice, we recommend the Cauchy distribution with center 0 and scale 2.5, which in the simplest setting is a longer-tailed version of the distribution attained by assuming one-half additional success and one-half additional failure in a logistic regression. We implement a procedure to fit generalized linear models in R with this prior distribution by incorporating an approximate EM algorithm into the usual iteratively weighted least squares algorithm. We illustrate with several examples, including a series of logistic regressions predicting voting preferences and an imputation model for a public health dataset.
We recommend this default prior distribution for routine applied use. It has the advantage of always giving answers, even when there is complete separation in logistic regression (a common problem, even when the sample size is large and the number of predictors is small) and also automatically applying more shrinkage to higher-order interactions. This can be useful in routine data analysis as well as in automated procedures such as chained equations for missing-data imputation
Keywords: Bayesian inference, generalized linear models, least squares, linear regression, logistic regression, noninformative prior distribution

Thursday, August 03, 2006

[ICPSR 2006] 不一樣與同樣

為了學好貝氏定理,我花了整整二年的時間,在 哥大以及一年前的 ICPSR 修了Bayesian Methods,在第二年的學習中,我對Bayesian Methods的掌握,使我大膽的向Professor Jeff Gill 毛遂自薦,要當他今年在 ICPSR Bayesian Methods 的TA.

同樣的機場?

去年搭乘Spirit Air 到了 Detroit Metro Airport ,下飛機到轉乘 九人巴 的地方,望眼所及是荒涼尚在建設的地方,為了搭乘 九人巴 ,我還得越過一遍泥濘的沙石地,印象中的Detroit Metro Airport ,是落後的。

今年搭乘 North West Airline ,不知是真因為航空公司不同的原因,下了飛機,我直覺反映就是,訂錯機票下錯機場, Detroit Metro Airport 整個是Modern到不行,包括要領個行李,都要搭乘機場捷運,相同的是,我還是要走好遠路,才能到達九人巴 乘車地點。據說是新規定,大眾運輸都得到停車場上車,所以車資也較往年多了10元停車費,總車資是55元。

不同的宿舍

去年住的是 University Towers ,位於 中校區以東,是個周邊機能好,有泳池、健身房的好地方,唯一缺點是,太沒有鄉下的感覺。周圍許多的獨棟的小木屋,才是我嚮往的。

於是今年我找了地點較偏遠的地方,位在中校區以南的住宅區,以為可以住到小木屋,沒想到它竟然是鐵皮屋搭建而成的宿舍,一間間的隔局,活脫脫是囚犯監獄,真是令人氣結。

2006 ICPSR,同樣的地點,不一樣的感覺。

Wednesday, April 05, 2006

Gibbs as the augmented data

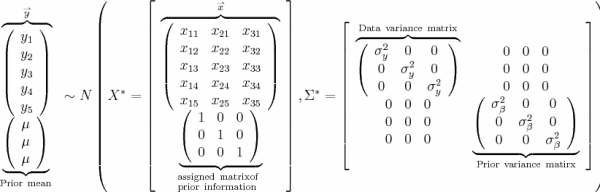
One implication behind the gibbs sampler is that it is actually using prior information as the aumented data. So if we have no information on prior (uniform prior), the variance compoent in the augmented covariance matrix will be bunch of zero's. And it is just the same as regression model.

However, if we do have information on prior, that is elicit prior, the prior can serve as a tool to identify beta's where the beta's in the original from is either colinear or unidentifiable.


See Andrew Gelman, 2004, Bayesian Data Analysis, ch 14 for details.

Monday, April 03, 2006

Quantitative vs Qualitative research methods 質化與量化研究方法的論戰

今天與朋友晚餐最後的話題,就是質化與量化方法的論戰,有趣的是,席間二對男女朋友,各自持著不同的意見,將這場質化與量化方法的論戰,意外地衍生成為一場男與女的戰爭,當然這一切不是本文的重點。

我個人因為學習的興趣,當然是量化方法的defender,但這並不代表我就覺得質化研究有什麼不好。事實上,我一直有個夢,就是能流浪到東歐或者是拉美小國中,好好的住上一年,觀察民情,進行田野調查,最終產生一篇博士論文with flesh and blood,也就是量化研究者會時時提醒自己的,"be sure to get close to your data"。當然這美麗的憧憬,在求學過程是不切實際地,不過,我假如有幸,我將致力完成它,就如同我完成其他夢想一般。

回歸本文重點,這場論戰有一個困擾其中一對男女朋友五年的例子;或許該這麼形容比較生動,這五年來,二人的各自立場沒有改變(男方是量化代表),這個例子在五年後的今天,仍使他們吵得不可開交,不知的旁人,會以為這二人真得在吵架呢。這個例子是這樣的:

假始你孤身在電梯裡,或走在暗巷,一個黑人的出現,是不是比一個白人的出現各使你具有警覺心。

男:引用紐約警方公布的研究資料,犯罪者多是黑人,所以這是當然的反應,黑人比白人可怕。
女:你充滿岐見(bias) ,你應該想想是不是生活環境使然,數字是可以騙人的。
男:我不否認我岐視(discriminate)黑人,就像假使我是老闆(商界),我寧可雇用白人也不雇用黑人,因為分析顯示,黑人IQ的確比白人笨。
女:又是錯誤的數字呈現,IQ雖然是客觀的測量方法,但是造成黑人白人智力的差別,大環境是很重要的因素,所以我們要更深入的去了解,才能做決定。


究竟誰對誰錯?我的回答是,都對!

首先,我贊同女方的意見,數字是可以騙人的。紐約警方的研究資料,可能是有問題,女方說的環境使然,就是統計上說要有控制covariates,否則其結果是biased。不過我相信紐約警方的報告應該不會粗淺到沒有加入covariates來分析,所以,假設這份報告是在研究上,是decent的,那我們該如何看這個問題?可以分做二點:

第一、其結果仍然不可信,因為我們無法進行counterfactual analysis,也就是說,今天我們必須要有identical unit,然後給予treatement and control,最後實驗、控制二項的差異,其所得的結果,才是valid因果推論,但在observational study,這是不可能的,一個貧窮的黑人,是不可能同時變成貧窮的白人,所以無論如何,這份報告,對於truth都有一定的偏差。我們唯一可以做的,就是使用非參數的方法,亦即是matching conditional on covariates,如此可以產生quasi-experiement,其結果當然就比較可信,當然,我們仍要make some assumptions。

第二、結果雖不可信,但是我仍建議採用!因為你做出錯誤判斷的probability是低的,畢竟現有的data告訴我們就是這樣,better methods more data也許會告訴我們相反的結果,但這就是reality,是研究上的限制,我們的生活又何嘗不是在經驗中,update我們對於事實的認知。所以我就問了男方一個問題:

我:假始你在做了十次一樣選擇,而這十次都證明了雇用的白人實際上產生較不佳的結果,你第十一次會做怎樣的選擇?
男:我會考慮用其他的標準。


當然首先要先攻擊我自己的問題,也就是我們也無法預料假始十次都雇用黑人是否就會得到較佳的結果。

我的問題很bayesian ,男方的回答當然也是bayesian,警方的報告,就像是bayesian中的priori ,而我們自己做的十次選擇則是new data,而男生的回答則是他有了較先前不一樣的posterior,所以在我們完全不知道一下刻會發生什麼的時候,priori往往給我們下決定的依據,即使priori是錯誤的,那也無可厚非,因為我們在往後的生活中,new data給我們不一樣的likelihood時,就會有不一樣的posterior認知,當然,用同樣的例子,假使n次中只有少數幾次結果不佳(20%? 30%?),其posterior仍是接近我們先前的priori的,new data必須給我們極端不同的likelihood,才會反轉我們對於posterior的認知,就像我提問的一樣。

結論,people learn! 量化比之質化是較efficient這是無可置疑的,質化學者往往質疑量化結果的validity,但是so what,we will learn to adjust our posterior through new data! 而這new data的產生,當然,可以是質化研究者的貢獻了!所以二者是相符相成的!