# R code
library(maptools)
tw.map <- read.shape("taiwan.shp")
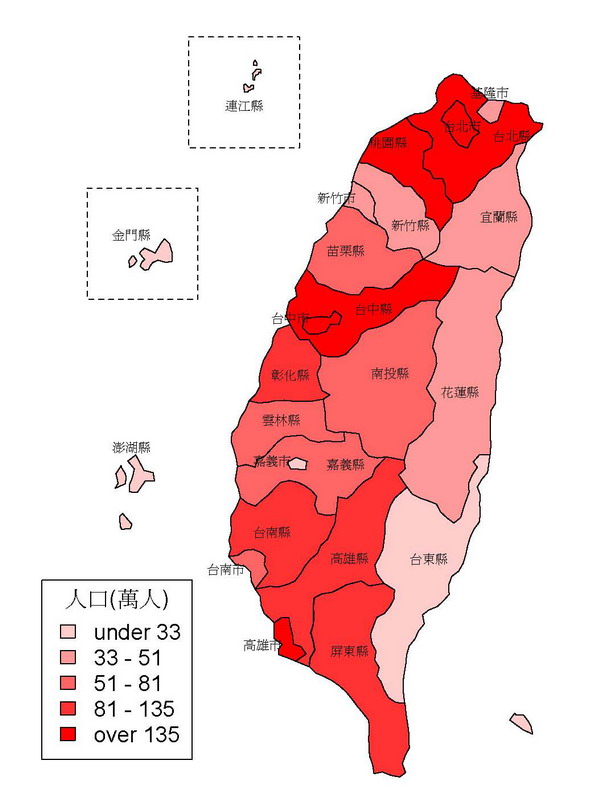
res <- plot(tw.map, auxvar=tw.map$att.data$POP06,
color="red", axes=F, xlab="", ylab="", pty="m")
str(res)
n.shp <- length(tw.map$Shapes)
x.pts <- tw.map$att.data$XLAB
y.pts <- tw.map$att.data$YLAB
legend(locator(1), legend=leglabs(round(res$breaks/10000,0)),
fill=res$ramp, bty="o", cex= 1.2, pt.lwd=3, title="人口(萬人)")
text(x=x.pts, y=y.pts, labels=tw.map$att.data$CNAME, cex=0.7)
rect(955, 1600, 1015, 1660, lty=2)
rect(1010, 1682, 1070, 1742, lty=2, xpd=T)
#rect(locator(1)$x,locator(1)$y,locator(1)$x,locator(1)$y)


6 comments:
你好,非常驚奇R竟然可以繪出台灣人口地圖。在執行時發現maptools裡沒有taiwan.shp。請問taiwan.shp的檔案你是從哪下戴呢?google一下只有在這找到相關資訊。
在ArcGIS這套軟體的世界地圖裡有台灣的地圖檔, 如果你人在台灣, 可以向圖書館或中研院詢問, 應該有地圖檔提供。
請問執行出
> tw.map <- read.shape("taiwan.shp")
錯誤在getinfo.shape(filen) : Error opening SHP file
此外: Warning message:
use readShapeSpatial:
objects other than Spatial objects defined in the sp package are deprecated >
應如何解決
謝謝!!
How were you able to post your data with the specific different-colored bins you have listed in the legend (under 33, etc.)?
您好,請問我該如何把地圖畫得更細一點嗎?
例如鄉鎮?
Post a Comment