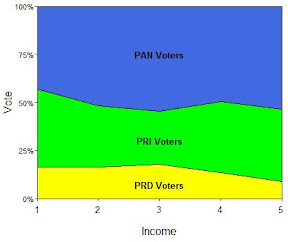
Code for the areaplot funtion
areaplot <- function(x, axes=T,
xlab="", ylab="", main="",
density = NULL, angle = NULL,
border = NULL, col = NA,
lty = par("lty"),...){
# density, angel, border, col, are vectors.
# see polygon for the usage
max.x <- max(apply(x, 1, sum))
n.t <- dim(x)[1]
n.x <- dim(x)[2]
# creat empty plot first
matplot(0,0, type="n",
xlim=c(1,n.t), ylim=c(0,max.x),
xaxs="i", yaxs="i",
axes=axes, frame.plot=T,
xlab=xlab, ylab=ylab, main=main)
# organize data
x.star <- matrix(0, n.t, (n.x+1))
for (i in 1:n.x){
x.star[,(i+1)] <- x.star[,i] + x[,i]
polygon(c(1:n.t,n.t:1),
c(x.star[,(i+1)], x.star[,i][n.t:1]),
density = density[i], angle = angle[i],
border = border[i], col = col[i],
lty = par("lty"),...)
}
}
Example
# Sample data
PRD <- c(16.16, 16.38, 17.78, 13.5, 8.82)
PRI <- c(56.8, 48.2, 45.51, 50.48, 46.32)
PAN <- c(27.04, 35.42, 36.7, 36.01, 44.85)
dat <- cbind(PRD, PRI, PAN)
par(mar=c(3.5,3,0.5,0.5), mgp=c(2,.25,0), tcl=-0.2)
areaplot(dat, axes=F,
xlab="Vote", ylab="Income",
col=c("yellow", "green", "royalblue"))
# axes tuning to make graph prettier
axis(2, at=c(0, 25, 50, 75, 100),
labels=c("0%", "25%", "50%", "75%", "100%"),
las=2, cex.axis=0.7)
axis(1, cex.axis=0.8)
text(x=c(3,3,3), y=c(7,30,75),
labels=c("PRD Voters", "PRI Voters", "PAN Voters"),
font=2, cex=0.8)
 |


6 comments:
You should make this into a function.
I expected that you would say this.
And I believe you would expect me to say the following. Please make this into a function!!
Masanao,
Ok, it is a function now!
You work so fast you don't even give me a time to comment..
Wao!
So I guess, you did a whole lot of excel users a lot of good?
And yet, you find a bug right away.
It's not that I find bugs. It's bugs that finds me...
Post a Comment