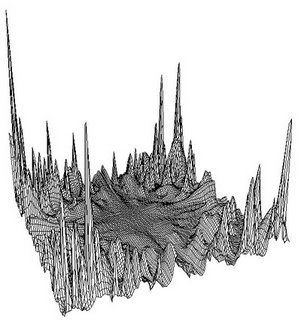
The R Graphic:
The R code:
target <- function(x,y){
abs(
(x*sin(20*y - 90) - y*cos(20*x + 45))^3
* acos(sin(90*y + 42)*x)
+ (x*cos(10*y + 10) - y*sin(10*x + 15))^2
* acos(cos(10*x + 24)*y)
)
}
x <- seq(-1,1,length=120)
y <- seq(-1,1,length=120)
z <- outer(x,y,target)
par(mar=c(0.2,0.2,0.2,0.2))
persp(x, y, z, theta=65, phi=15, box=F)
The usage of persp.
persp(x, ...)
## Default S3 method:
persp(x = seq(0, 1, len = nrow(z)), y = seq(0, 1, len = ncol(z)),
z, xlim = range(x), ylim = range(y),
zlim = range(z, na.rm = TRUE),
xlab = NULL, ylab = NULL, zlab = NULL, main = NULL, sub = NULL,
theta = 0, phi = 15, r = sqrt(3), d = 1, scale = TRUE, expand = 1,
col = "white", border = NULL, ltheta = -135, lphi = 0, shade = NA,
box = TRUE, axes = TRUE, nticks = 5, ticktype = "simple", ...)


No comments:
Post a Comment